|
Intensity-Duration-Frequency (IDF Analysis)
|   |
|
Intensity-Duration-Frequency (IDF Analysis)
| |
This module performs analyses of precipitation intensity-duration-frequency from long-term precipitation records. It lists and ranks storms and fixed-interval events. Some of its functionality is found in the SWMM 4 RAIN and SWMM 5 Statistics modules. Its results can be compared with National Weather Service Precipitation Frequency Information, TP-40 (Hershfield, 1961), Bulletin 71 (Huff and Angel, 1992), and other rainfall frequency analyses.
Multiple stations can be processed at once either by selecting an input file with multiple rain gages, or by selecting more than one file in the input file selection dialog.
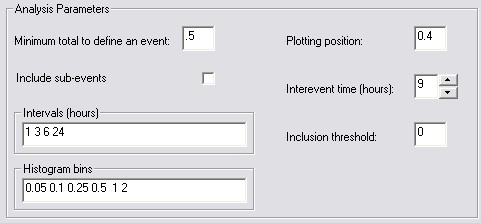
The minimum total to define an event can be set to a large value if the user is not interested in small storms. Setting it to a small value permits listings of small events and tabulation of rainfall depths at short return periods and durations. For example, if the user is interested in determining the 2-week 1-hour rainfall, the minimum event total should be set below the expected total, such as at 0.1 inches. However, setting the threshold low increases the program's run time. If the primary interest is, for example, finding the 25-year, 24-hour rainfall, which is expected to be 4 inches or more, this value can be set to a larger value such as 2 inches.
Plotting position is typically set at 0.4 for the Cunnane distribution (precipitation data) and at 0 for the Weibull distribution (streamflow data).
If sub-events are included, a single storm can show up more than once in a list of fixed-duration events. For instance, in Boston, Hurricane Diane in August 1955 had three of the largest one-hour precipitation totals on record. The 1-hour event list would list each of these occurrences if sub-events are allowed, and would list only the greatest value of the three if sub-events are excluded. Sub-events should be excluded when performing an IDF analysis. They should be included only if the listing of events is primarily being used to identify storms.
Interevent time has a major bearing on the listings of "continuous" storm events and plays a minor role in selection of interval events if sub-events are excluded. It is recommended that the interevent time be chosen to obtain a resulting coefficient of variation (standard deviation divided by mean) of 1. NetSTORM displays the coefficient of variation in its results. A trial and error approach should be used to identify the appropriate interevent time. As examples, it has been found to be 12 hours for Dallas, 8 hours in Indianapolis, and 5 hours in Boston. Dry periods longer than the minimum data gap to flag are excluded from the interevent time coefficient of variation calculation. This facilitates exclusion of seasonal dry periods from the computation of this parameter. Thus, with the minimum data gap to flag set to 30 days, an interevent time of 33 hours for Sacramento yields a coefficient of variation of 1.
In the Intervals box the user enters a space or comma delimited list of the durations at which IDF calculations should be performed. Many rainfall atlases tabulate rainfall depths for selected return periods at durations of 1, 2, 3, 6, 12, and 24 hours. Durations below one hour may be analyzed if data has been collected at higher frequency or it has been synthetically disaggregated. Durations of 48, 96, and 120 hours are listed in some atlases as well. NetSTORM takes more time to analyze long durations. Analyses of any other duration (e.g. 7 hours) can also be performed.
Selecting a non-zero Inclusion threshold instructs NetSTORM to report averages instead of totals. This is useful for analyzing streamflow and other non-volumetric time series. Values below the inclusion threshold are censored from the time series. The remaining values are parsed into events and averages are reported for each event and specified interval. This allows one to calculate, for example, the 2-year, 6-hour mean streamflow from an hourly time series. NetSTORM can only parse events if the inclusion threshold is high enough to discretize events. If a stream has no baseflow, a small inclusion threshold, such as 0.001, is adequate. If a stream has strong seasonal variation, then a fixed exclusion threshold may not be appropriate for parsing events. E.g. if baseflow is near 100 cfs in spring but 10 cfs in summer, setting the threshold to 100 cfs may censor some summer events that belong in the analysis. In this case, external manipulation of the time series may be warranted to remove baseflow prior to IDF analysis.
The Histogram bins list identifies threshold event depths that will be counted for each year of record. Setting the bins as in the example above would produce the results shown below for Atlanta precipitation. The list shows, for example, that there were 16 events in 1969 with depths between 0.5 and 1.0 inches. This table might be used to select 1976 as a "typical year" for local precipitation based on its storm depth distributions lying close to the long-term means.
Year Total Records Mean StDev Maximum Duration Interevent Histogram Bins (>=n)
0.00 0.05 0.10 0.25 0.50 1.00 2.00
1969 44.40 532 8.346E-2 0.162 2.30 15.7 227 20 8 18 12 16 11 3
...
1975 66.00 699 9.442E-2 0.153 1.63 14.0 163 25 7 17 16 28 15 6
1976 45.96 571 8.049E-2 0.121 1.09 18.1 212 21 6 16 13 13 10 4
1977 46.68 536 8.709E-2 0.150 1.51 14.6 204 19 14 13 15 16 9 4
...
Mean 48.75 546.4 8.921E-2 0.145 1.45 14.7 195 22.3 8.7 15.5 15.6 16.0 11.2 4.1
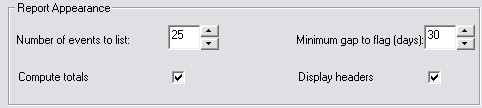
The number of events to list only affects the appearance of the output file. It has no bearing on calculation of IDF parameters.
The minimum data gap to flag is used to help the user identify potential missing data in a record. In the Eastern US, most stations rarely experience dry periods longer than 30 days. Setting this parameter to 25 would identify any potential data gaps that can skew IDF analyses. In the Western US, dry periods may naturally extend six months or longer. The parameter may be set to 150 days or longer to avoid listing every dry season.
Unchecking Compute totals eliminates the annual summary tables.
Unchecking Display headers collapses the Interval Totals listings into a single table suitable for transfer to a database or spreadsheet
Event statistics are automatically fitted to a GEV distribution for records of at least three years' duration
Output:
- monthly and yearly precipitation totals
- ranking of storms by volume
- ranking of fixed interval precipitation by volume (e.g. 6-hour accumulations)
- computation of design storm depths for return periods from 1 week to 5 years
- count of number of storms exceeding a selected threshold
- reporting of periods with no precipitation