|
STORM (Storage Treatment Overflow and Runoff Model)
|   |
|
STORM (Storage Treatment Overflow and Runoff Model)
| |
STORM analysis of storage, treatment, and overflow volumes. This module is similar to HEC-STORM. It uses the Rational Method to compute runoff, and computes overflow volumes for a specified storage volume and treatment rate. No data files other than precipitation data are required; the user is prompted to enter each parameter.
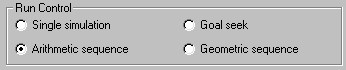
Single simulation runs STORM once. A detailed summary of rainfall runoff and overflow for each storm in the period of record is printed.
Arithmetic and Geometric sequence run STORM repeatedly to develop a table of storage-treatment-overflow. Only summary results for each run are saved.
Solver runs STORM repeatedly to meet criteria you specify for capture efficiency or overflow frequency. Only summary results for each run are saved.
With units set to metric, precipitation file should be millimeters per hour. For US (English) units, inches per hour is assumed. For both cases, hourly precipitation data is expected. US units can operate with either MG (million gallons) or acre-feet for storage volumes.
![]()
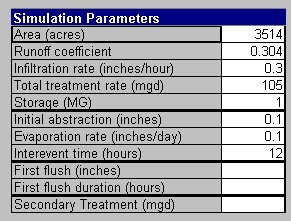
Area (acres or ha). Set units to acre-feet and Area = 1 acre to perform unit storage analyses.
Runoff coefficient - Normally between 0 and 1. Urban areas can be 0.8 or higher, open areas 0.05 or less. In Edit|Options, you may toggle the program to accept either percents or fractions.
Infiltration rate (inches/hour or mm/h) - rate at which rainfall infiltrates onto pervious surfaces. Excess rainfall immediately becomes runoff. Enter a large value (e.g. 10"/h) to exclude runoff from pervious areas. This parameter is analogous to the final infiltration rate in the Horton infiltration equation.
Total Treatment rate (MLD, mgd, or ac-ft/day) - the facility treatment rate
Storage (ML, MG, or ac-ft) - in-system storage volume
Initial abstration (inches or mm) - also called depression storage. 0.15 is a typical value.
Evaporation rate (inches/day or mm/day) - a constant rate at which depression storage is emptied. 0.15 is a typical value
Interevent time (hours) - used to define number of events; doesn't affect storage/treatment volumes. 6 hours is a typical value
Optional parameters
First flush depth (inches or mm) - used in water quality estimation to evaluate how much of "first flush" is captured. Specify the depth of rainfall that is considered first flush runoff.
If a positive value is entered, the first flush depth must be treated before an overflow occurs to avoid triggering a failure.
If a negative value is entered, an overflow won't be triggered once the specified depth of precipitation occurs.
First flush duration (hours) - Enter a time within which first flush occurs.
If a positive value is entered, a first flush failure occurs when there is an overflow before EITHER the first flush depth criterion has been met OR the first flush duration has been exceeded. For example, if the depth is 0.3" and the duration is 4 hours, no first flush failure would be recorded after the 4th hour of a storm, even though only 0.2" of rain fell in the first 4 hours and an overflow occurred in the 5th hour.
If a negative value is entered, a first flush failure occurs when there is an overflow before BOTH the first flush depth criterion has been met AND the first flush duration has been exceeded. A first flush failure would be registered if an overflow occurred anytime before the specified depth was exceeded or if an overflow occurred before the specified duration elapsed.
Secondary Treatment - used to evaluate secondary bypass in a treatment plant. This is a value less than or equal to the primary treatment rate. The model will then compute statistics for how often the lower treatment rate is exceeded. This parameter is only available when Single simulation is selected.
Output
Output from Single simulation analysis lists precipitation and overflow for each storm in the period analyzed. Output units are inches or mm and hours. Overflow depths may be converted to volumes by multiplying by the area in a spreadsheet (e.g. convert inches to MG by multiplying inches * area * 43560 / 12 * 7.48 / 1E6).
DUR - hours; RAIN - inches; RUNofF (inches or mm);
IMAX - peak hr (inches or mm); OVERflow (inches or mm)
OVMX - peak CSO (in/h or mm/h); STORage (in or mm) at end of storm
ANTEcedent runoff before overflow (inches or mm);
FULL - hours at capacity; FLOW - hours with stormflow;
BYPasS - hours with bypass active
##### START TIME DUR RAIN RUNF IMAX OVER OVMX STOR ANTE FULL FLOW BYPS
1 8/01/1954 1:00 1 0.020 0.000 0.020 0.000 0.000 0.000 0.000 0 0 0
2 8/03/1954 7:00 8 0.930 0.241 0.400 0.091 0.060 0.099 0.132 2 13 13
3 8/09/1954 11:00 17 0.340 0.063 0.100 0.000 0.000 0.000 0.063 0 8 8
The output also includes a summary table listing average annual precipitation, runoff, and overflow statistics as shown:
Average annual statistics for 37.92 years:
Precipitation (inches) = 44.473
Evaporation (inches) = 8.034
Runoff (inches) = 11.271
Pervious Area Infil. (inches) = 35.448
Pervious Area Contribution = 6.2%
Overflow (inches) = 3.470
Overflow (MG) = 1319.083
Capture = 69.2%
Antecedent runoff (inches) = 6.430
Number of overflows = 17.38
Failures to catch first flush = 0.00
Hours of stormflow = 717.52
Hours bypass operation = 717.52